Work by Spencer Kwon, Yueran Ma and Kaspar Zimmermann

Overview
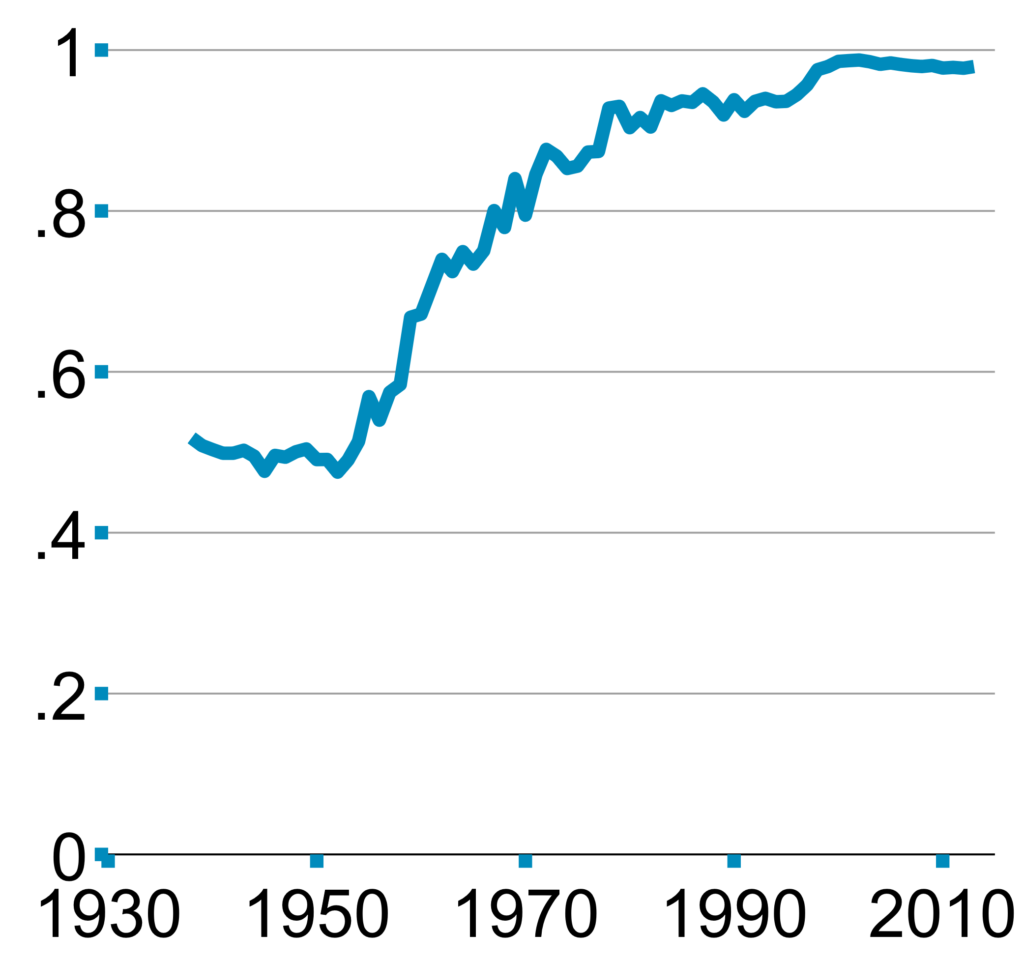
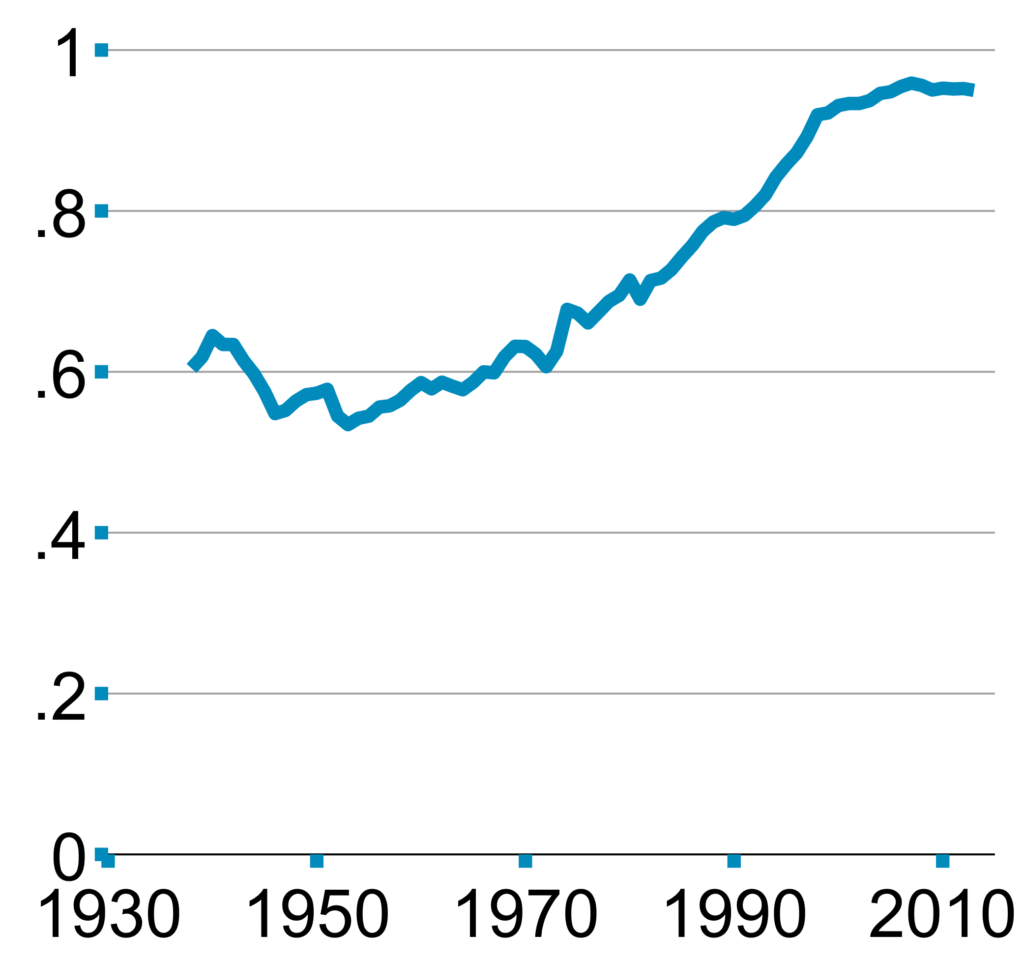
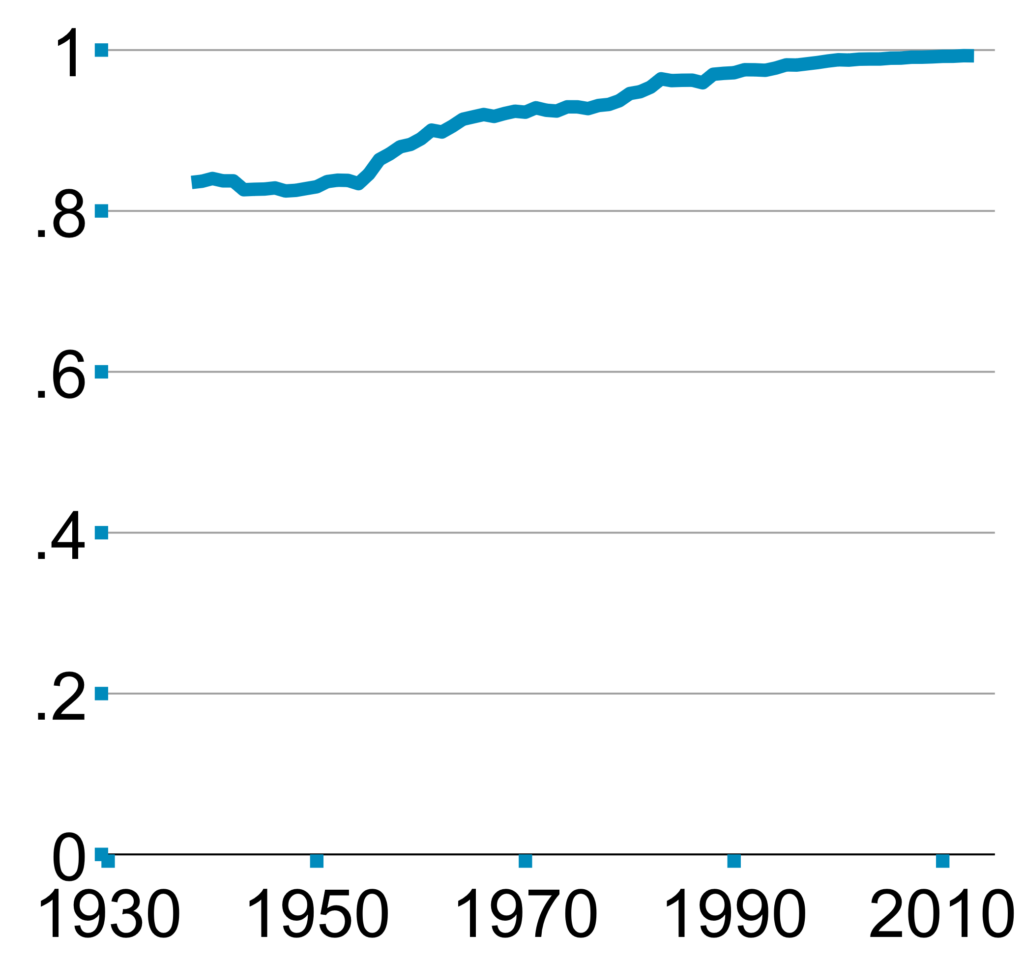
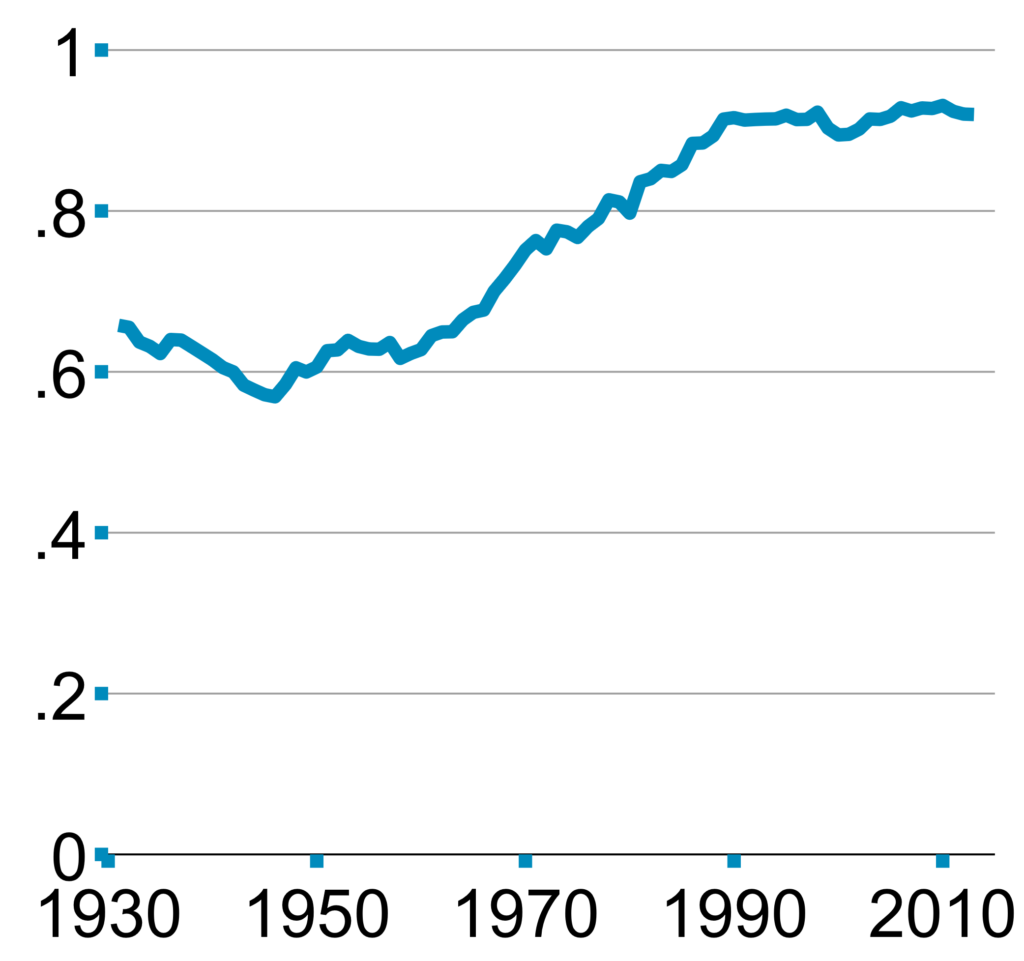
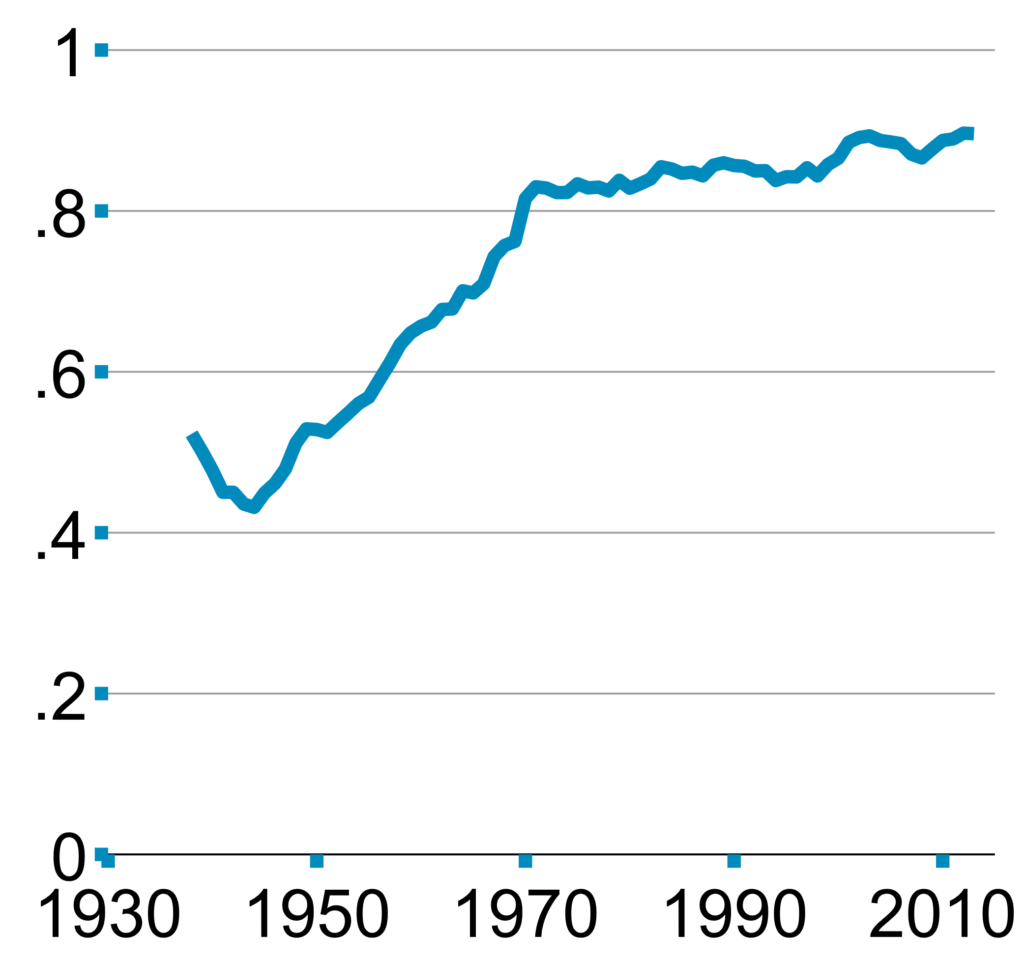
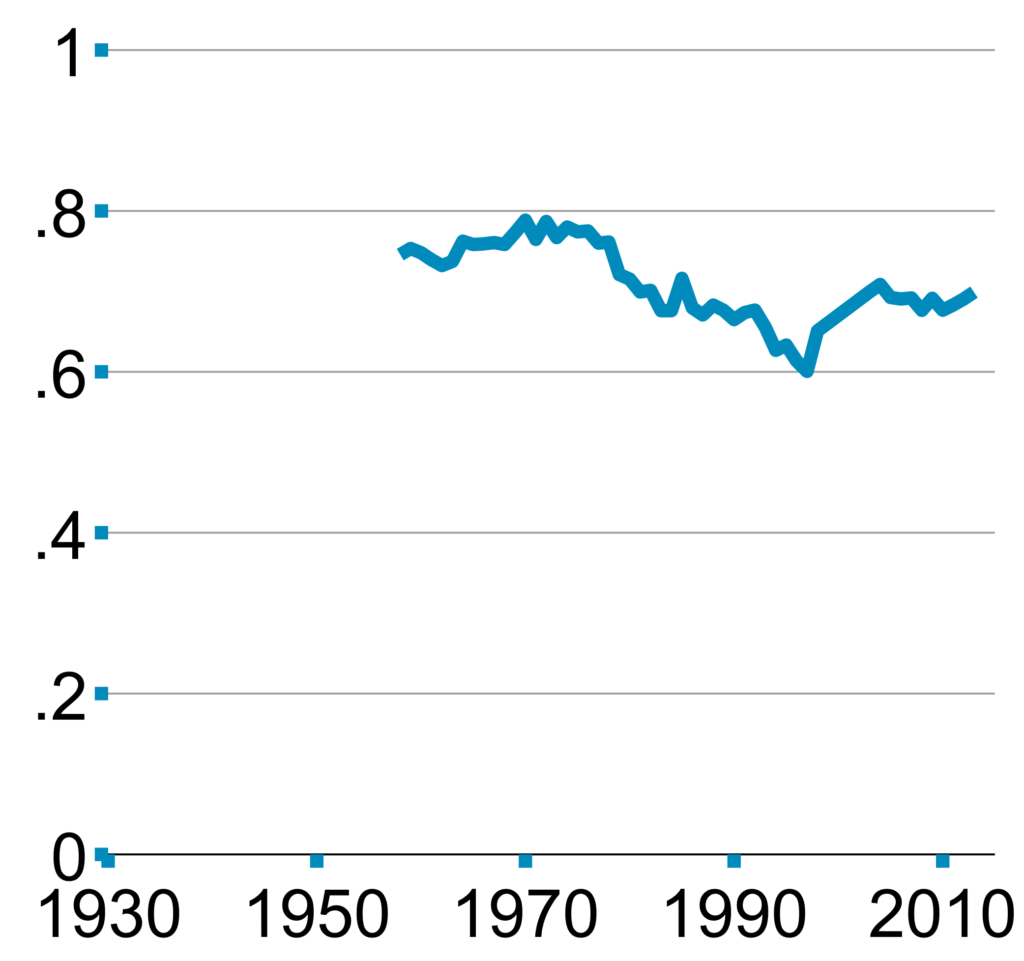
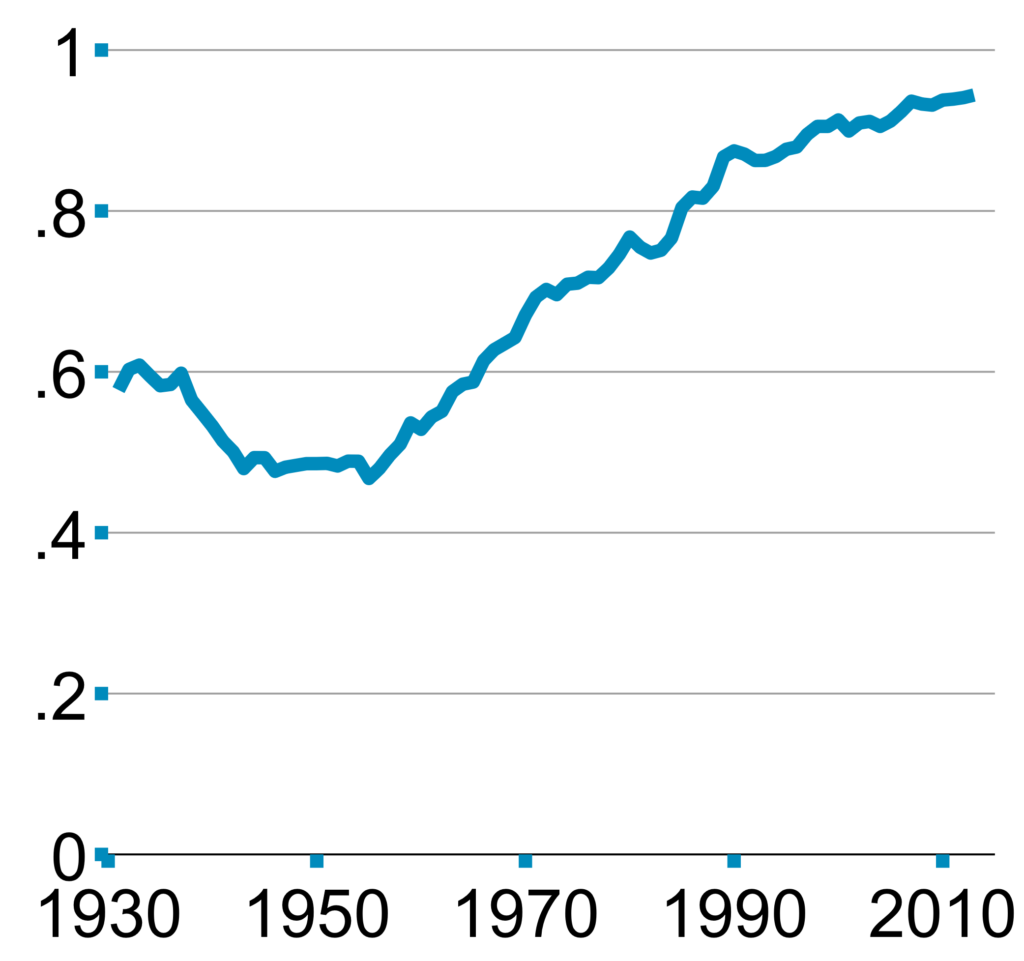
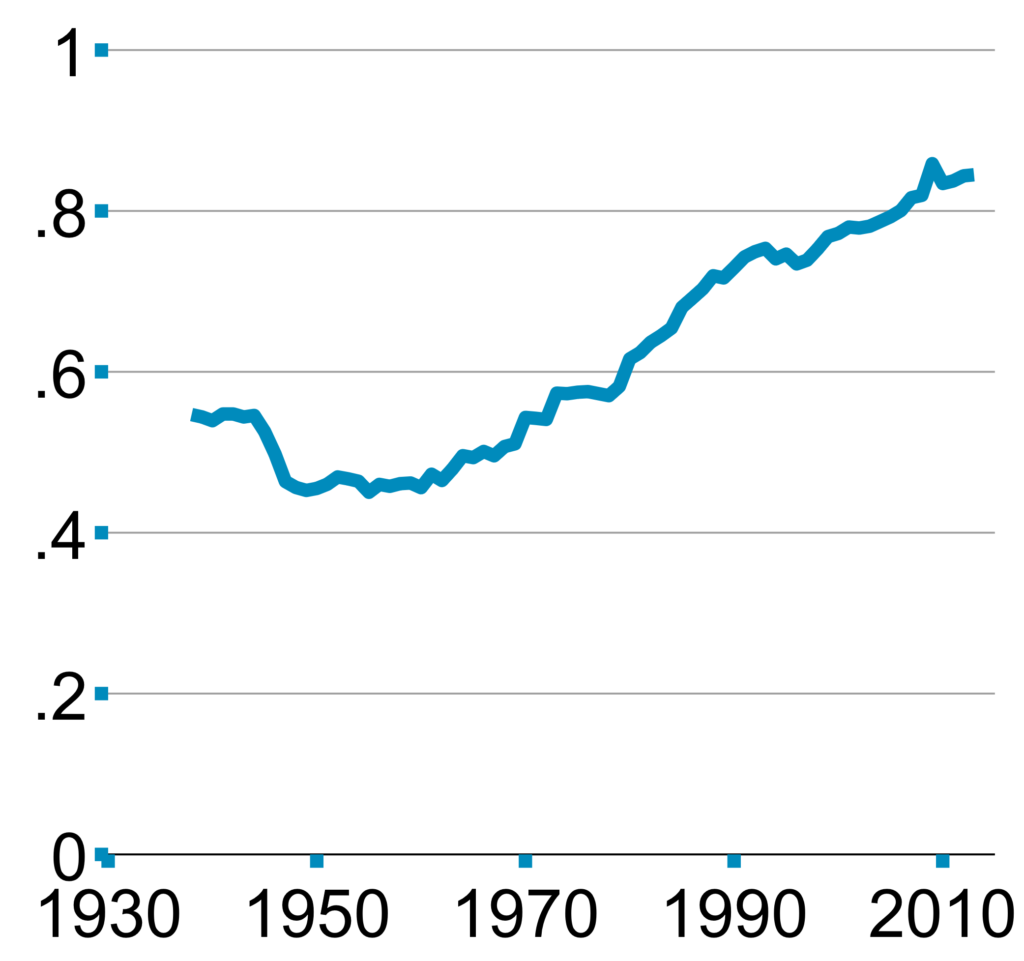
We measure concentration among production activities in the U.S. by digitizing the size distribution of all U.S. corporate businesses from 1918 to 2018.

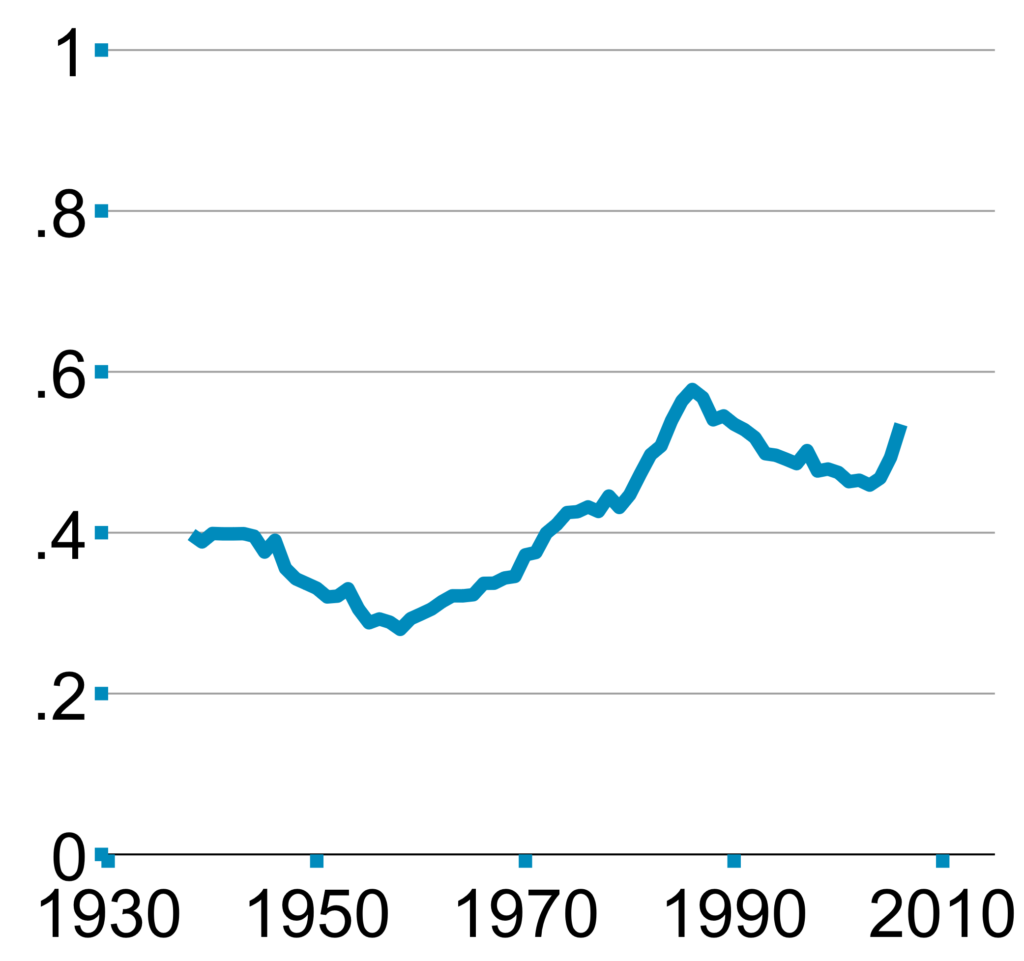
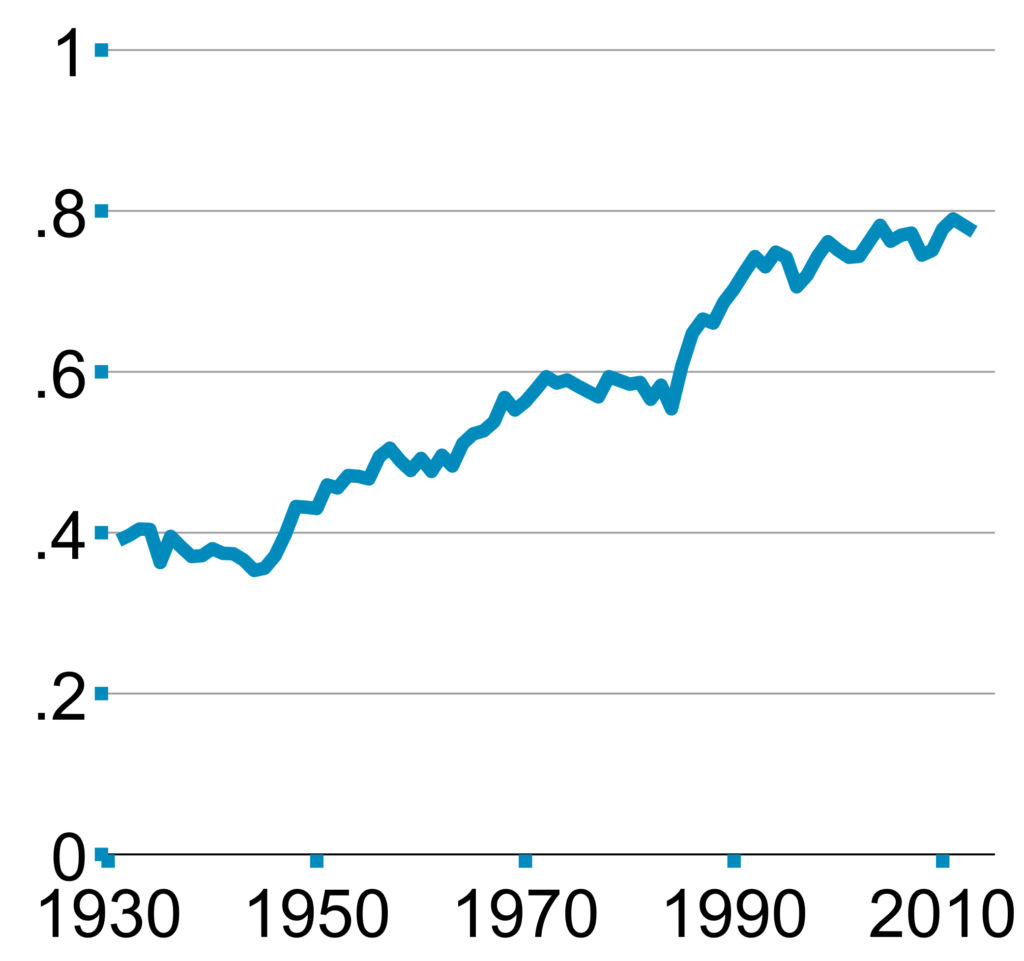
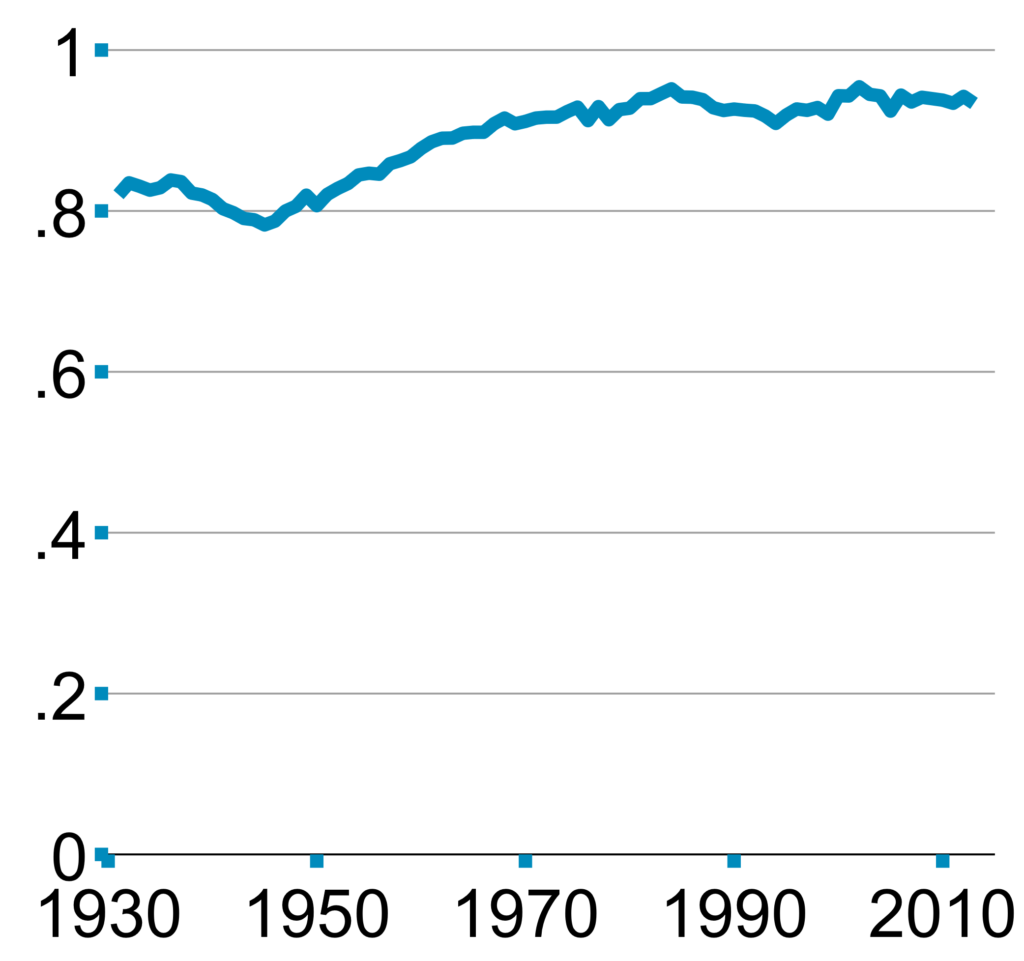
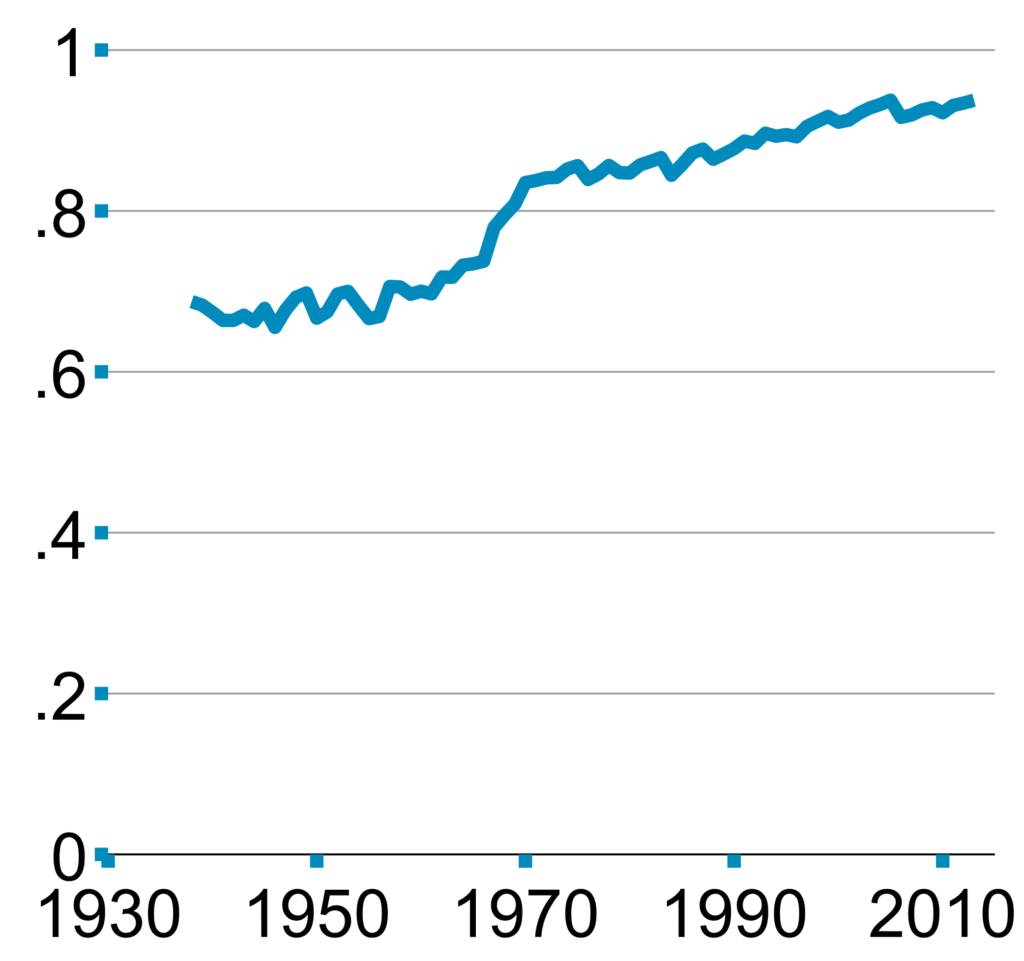
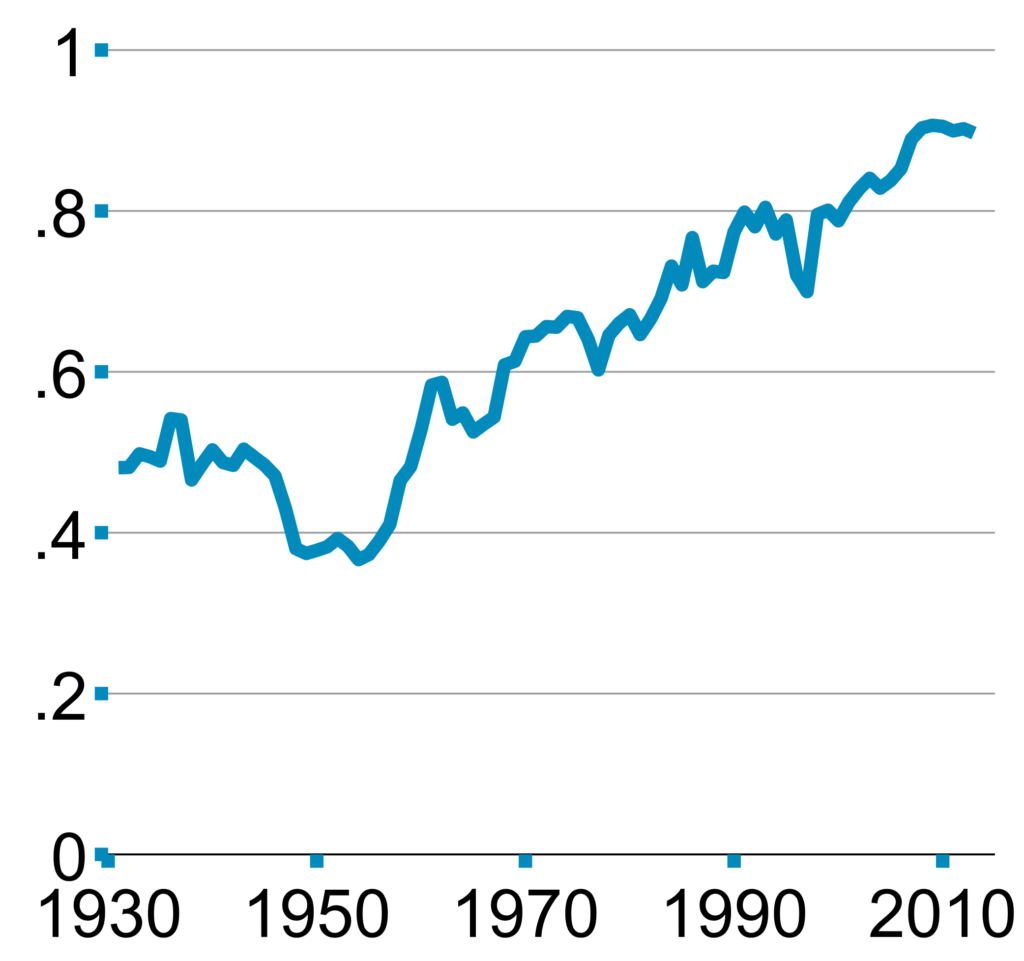
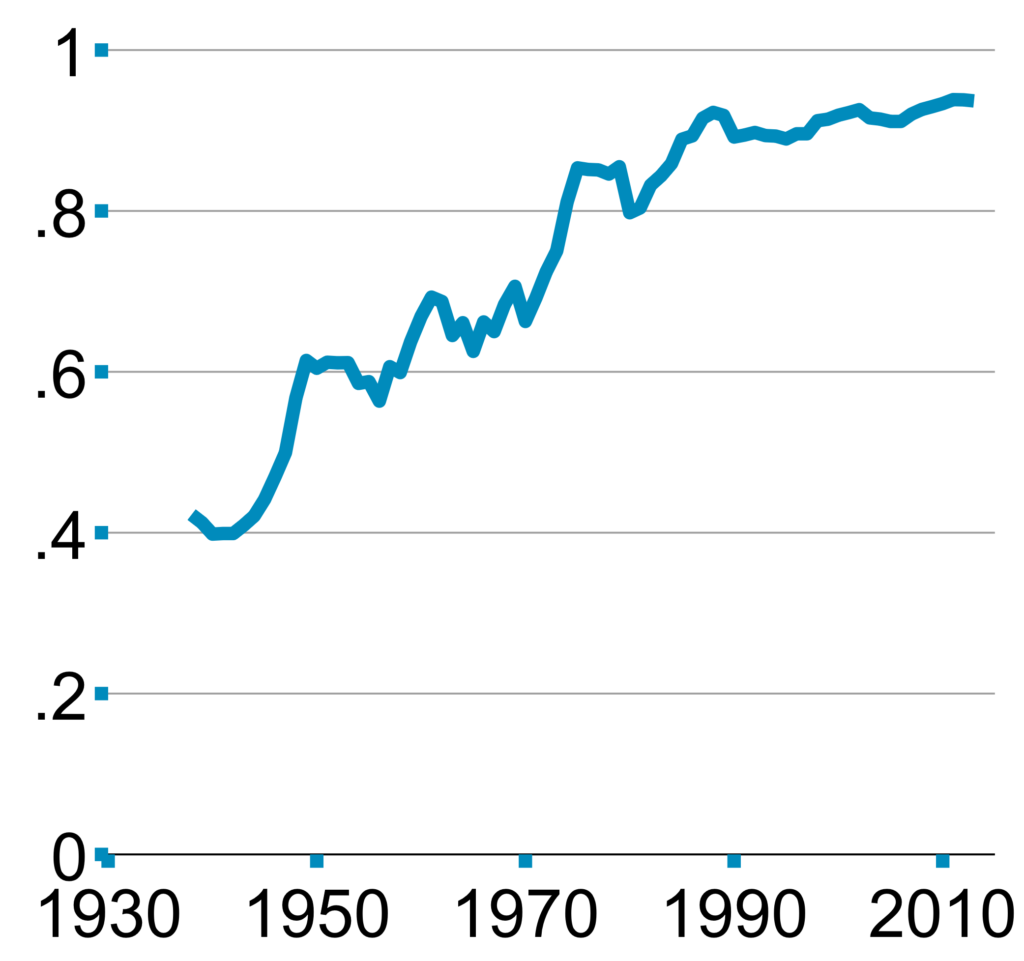
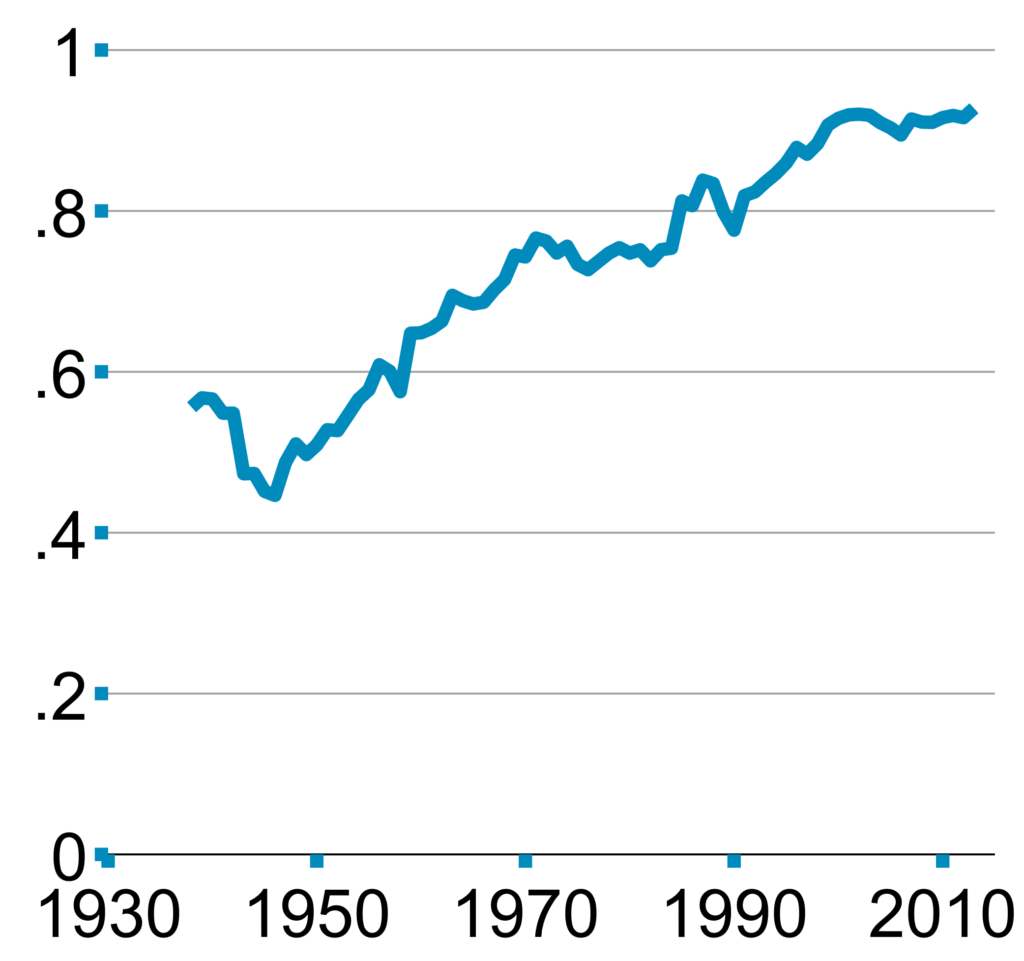
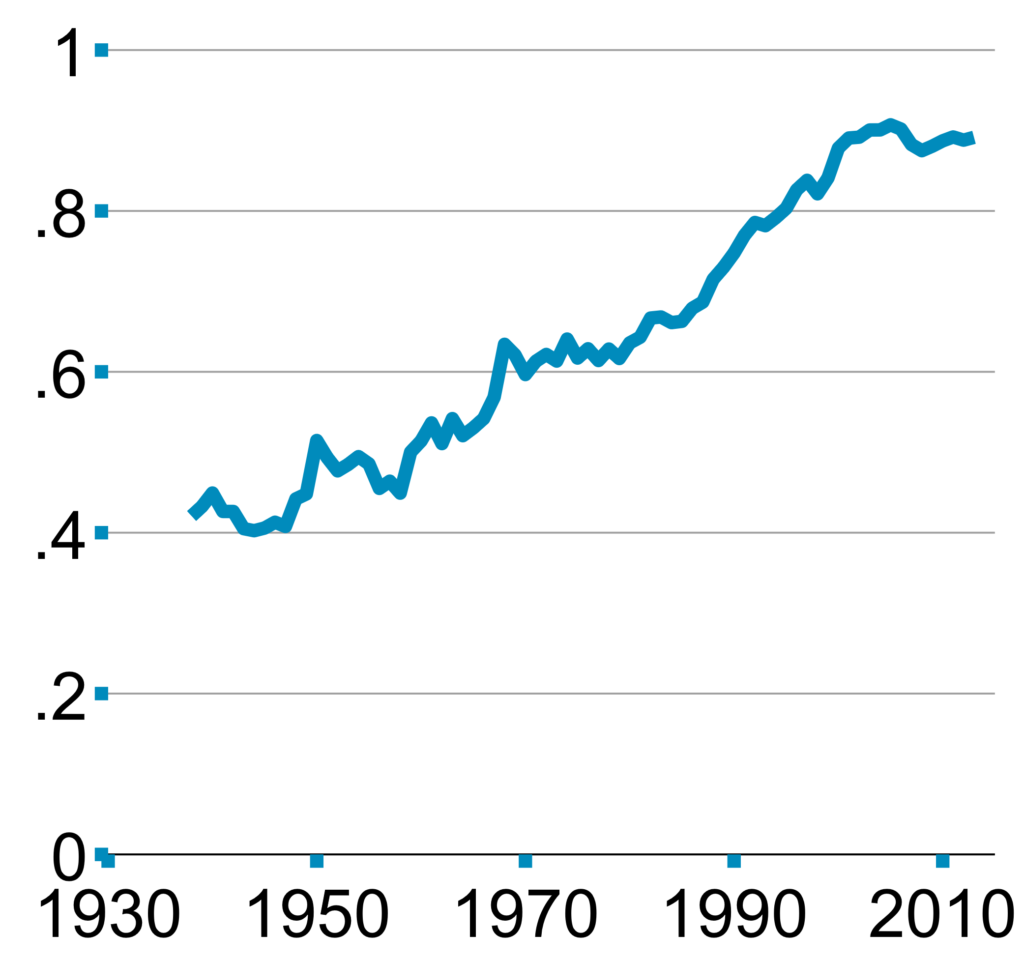
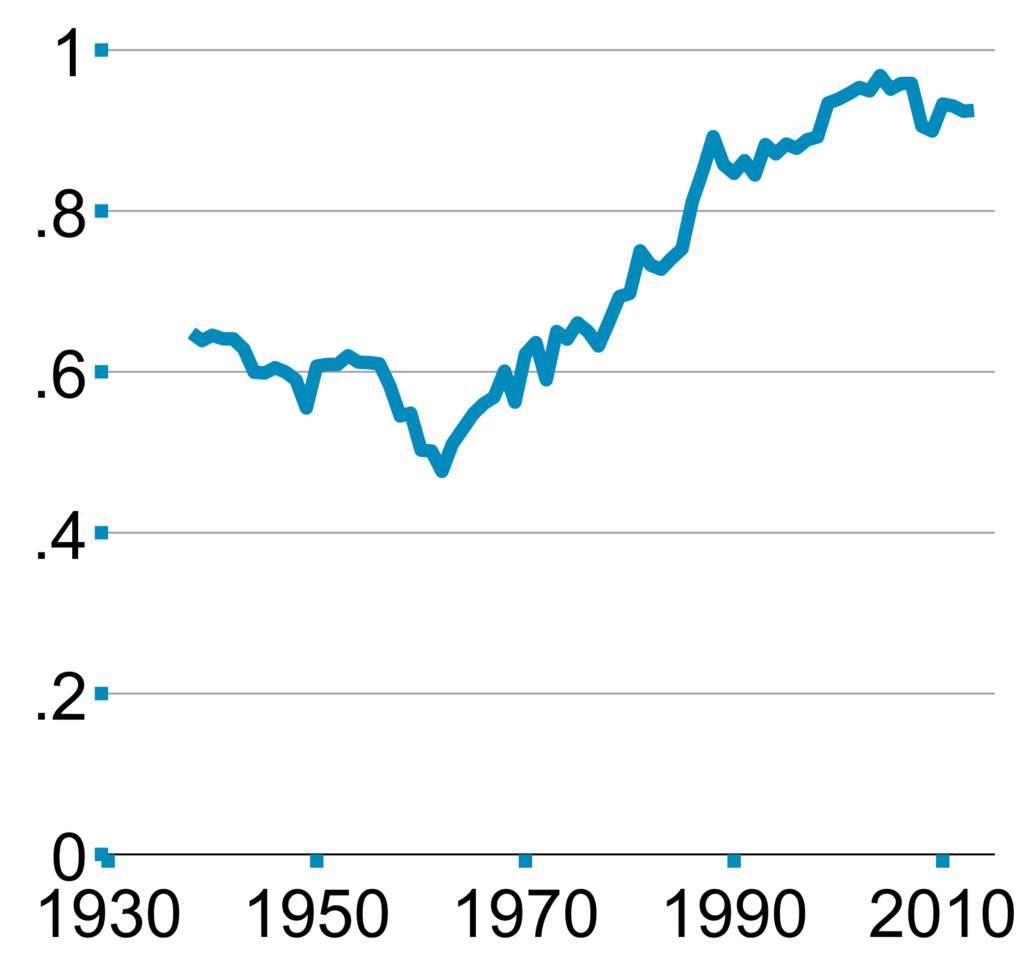
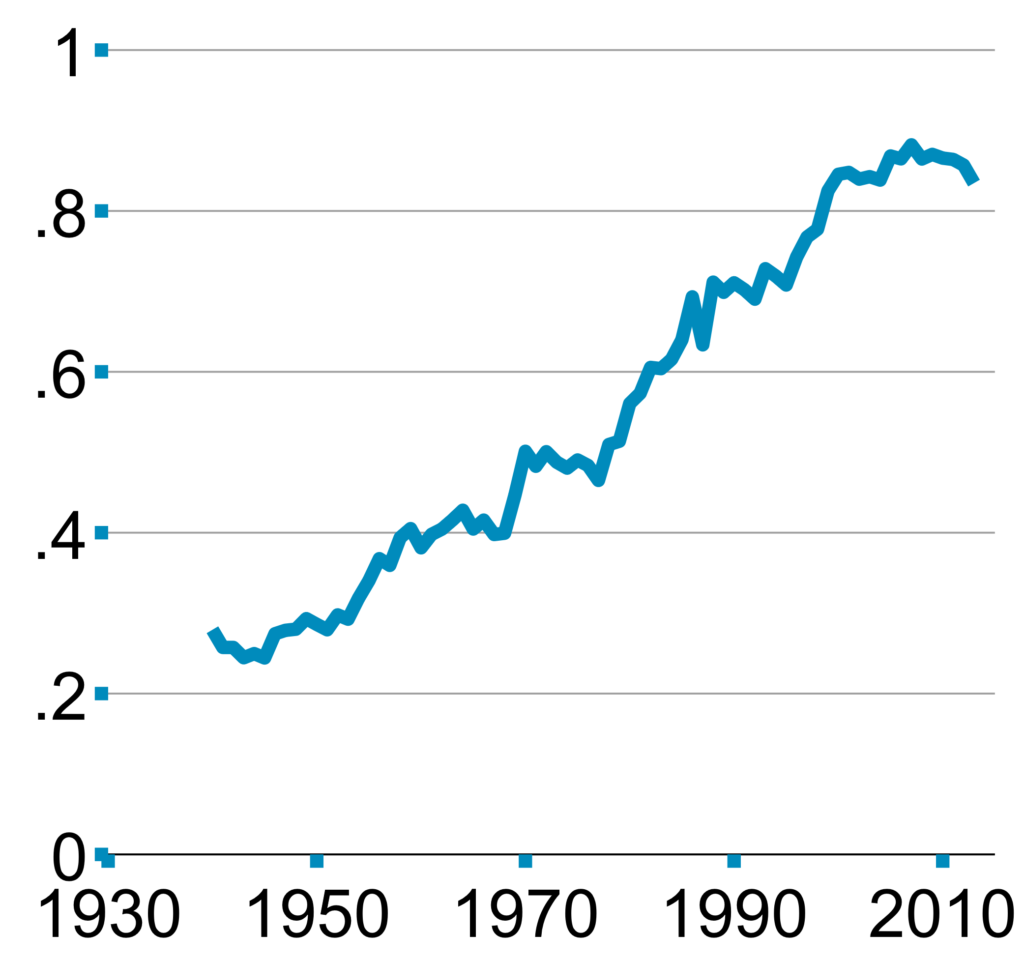
For the aggregate economy, the share of top businesses has been consistently increasing for the past 100 years.
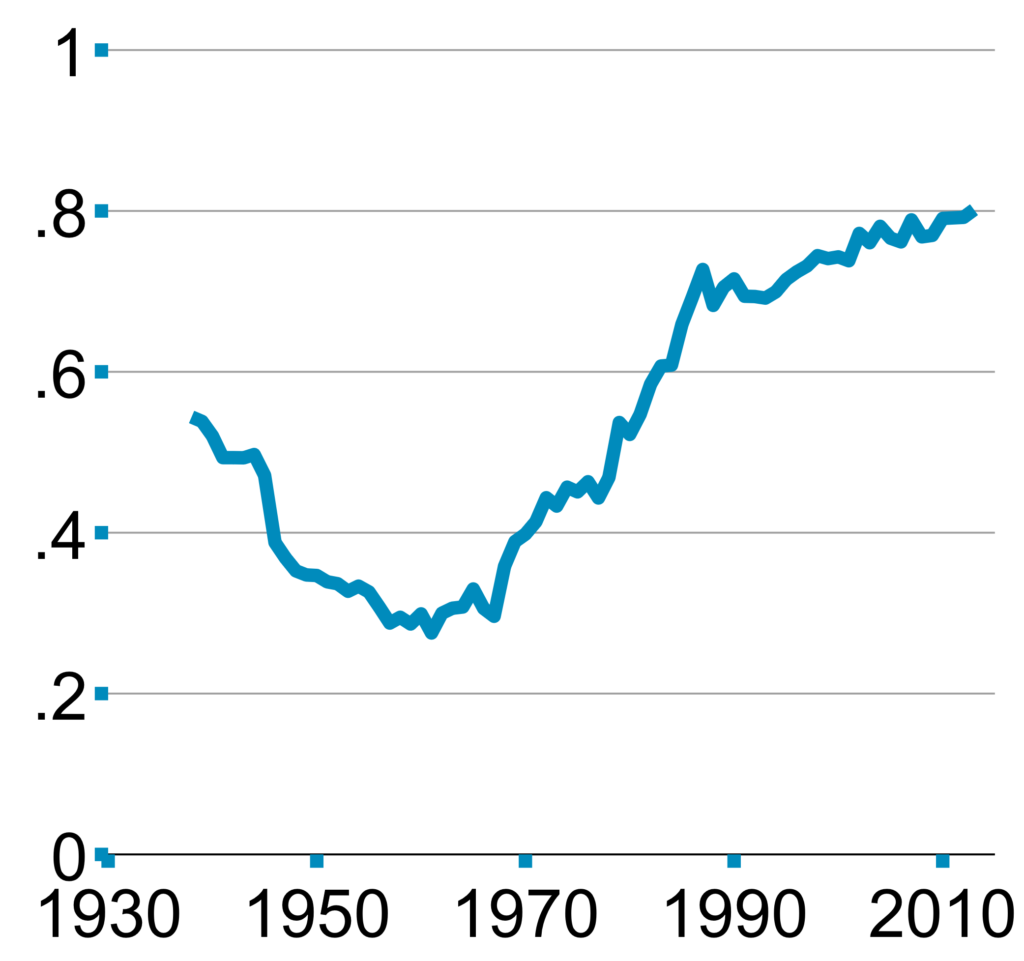
This figure shows the shares of top 1% (first panel) and top 0.1% (second panel) corporate business. The red line with triangles shows the share of assets accounted for by top businesses sorted on assets. The green line with squares shows the share of sales accounted for by top businesses sorted on sales. The light blue line with circles shows the share of net income accounted for by top businesses sorted on net income (restricting to those with positive net income).
Top 1%
Top 0.1%
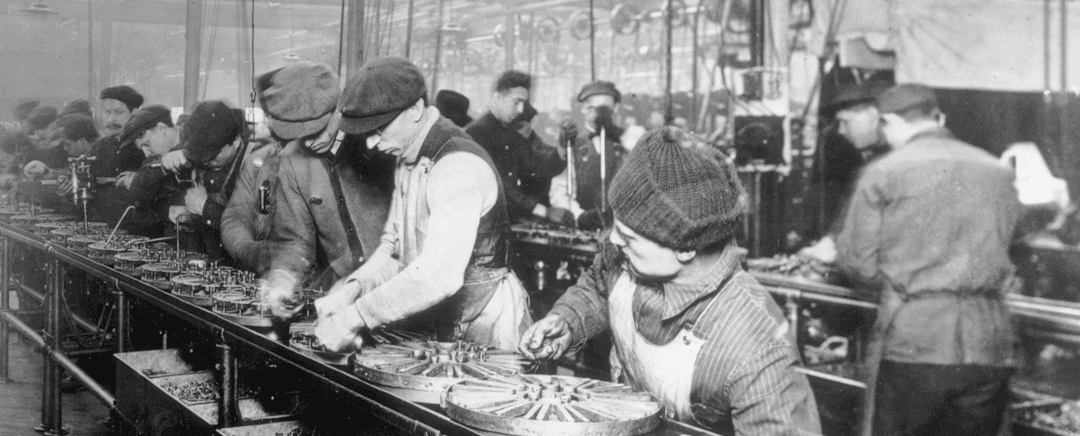
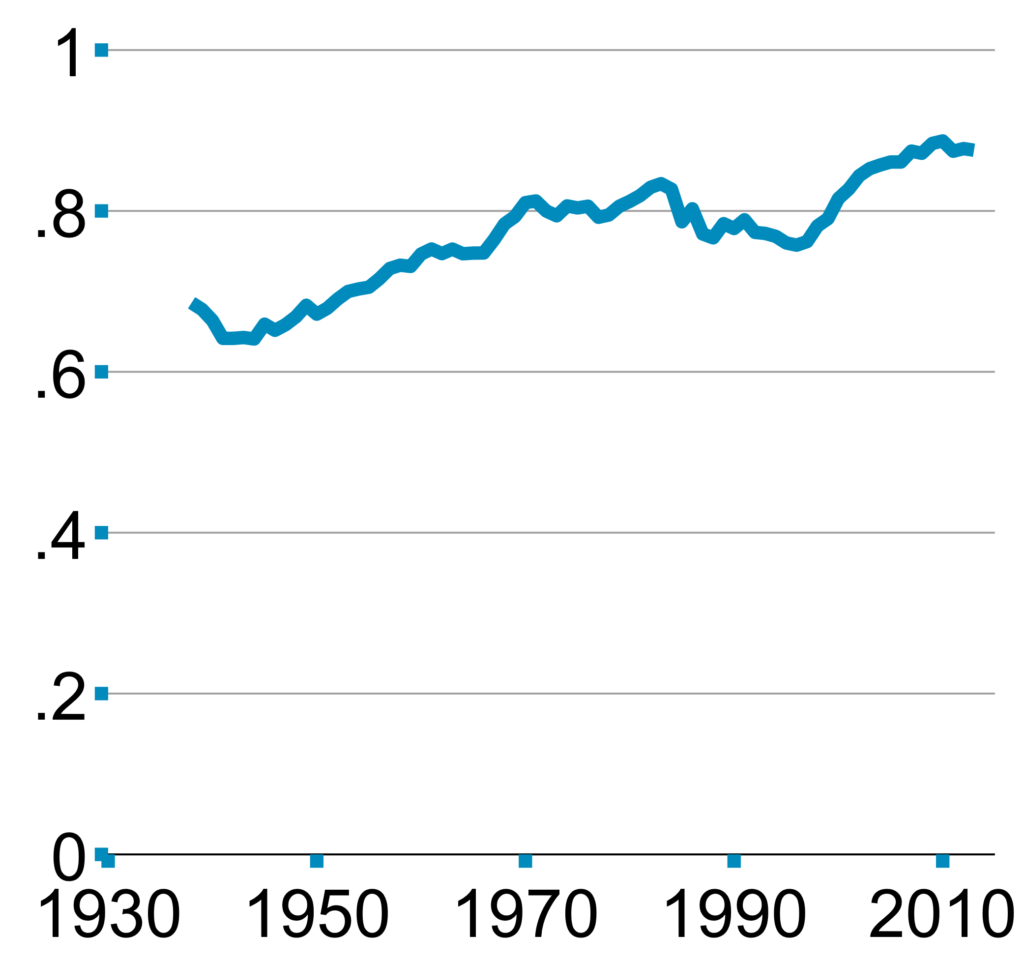
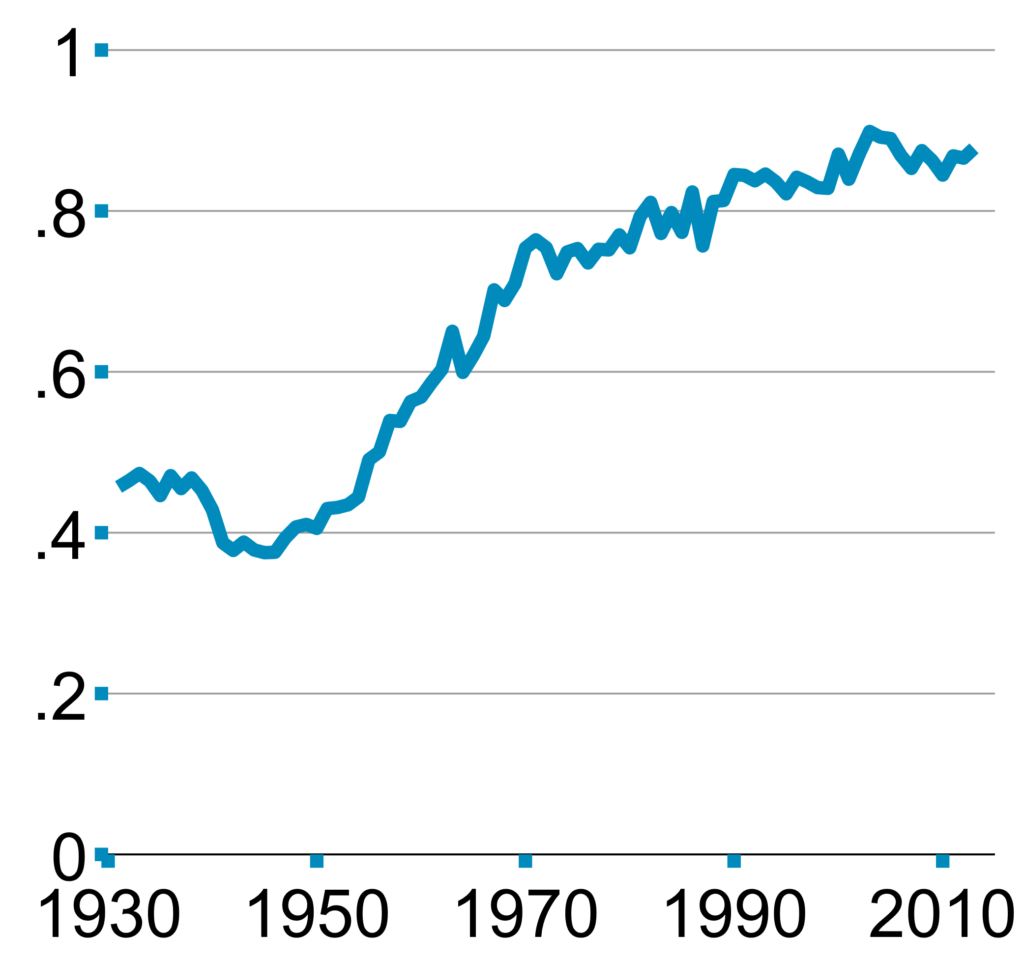
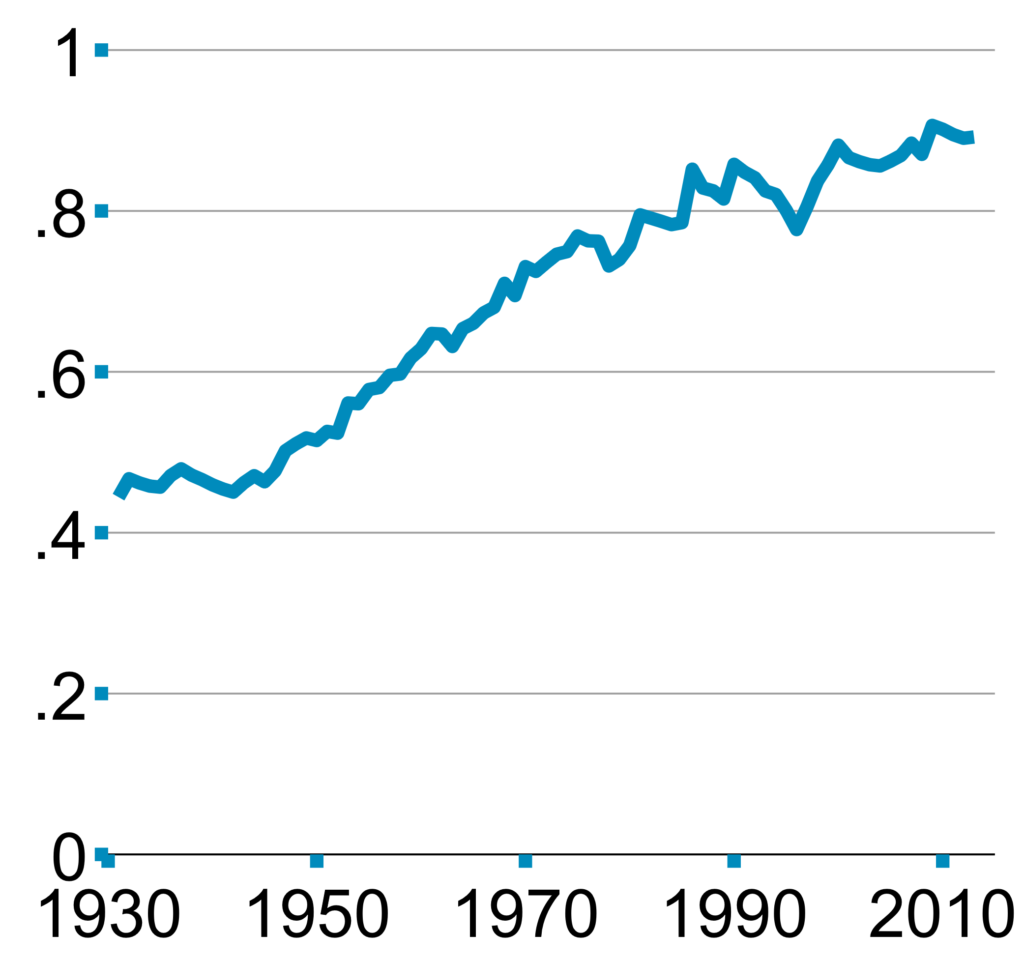
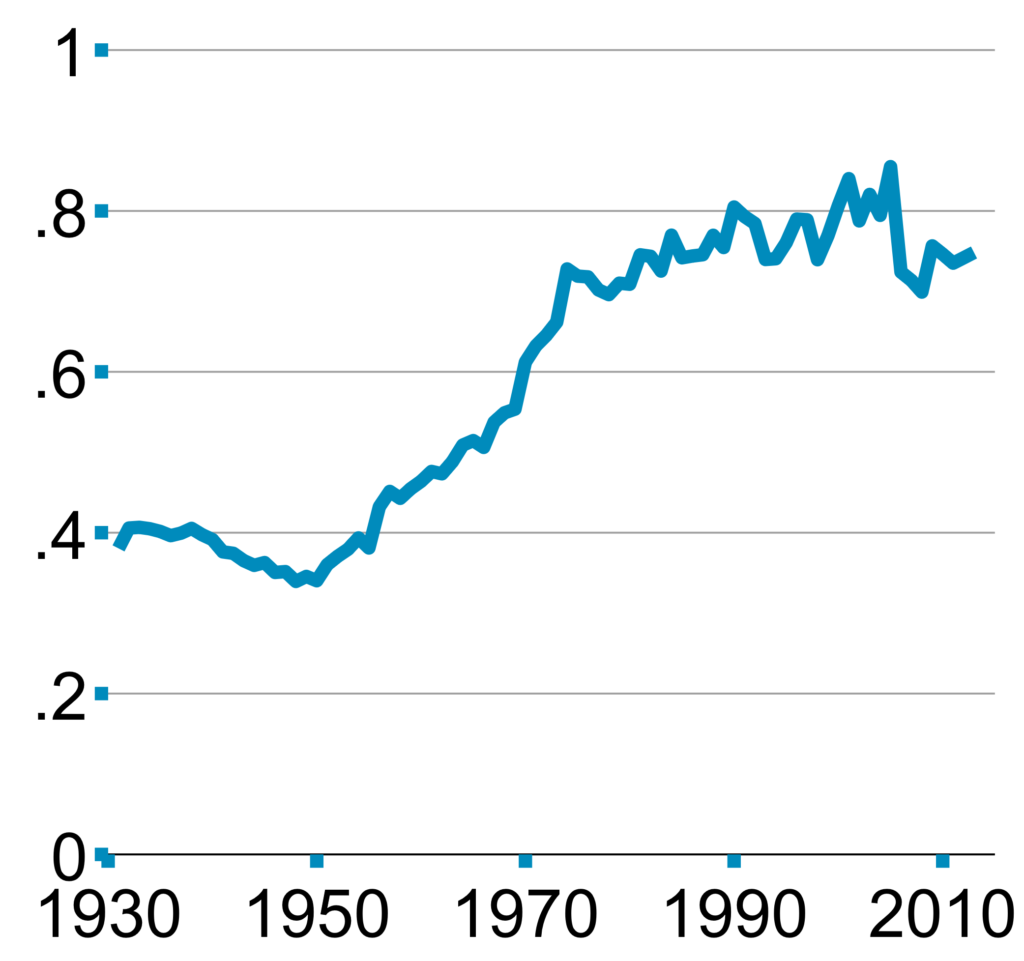
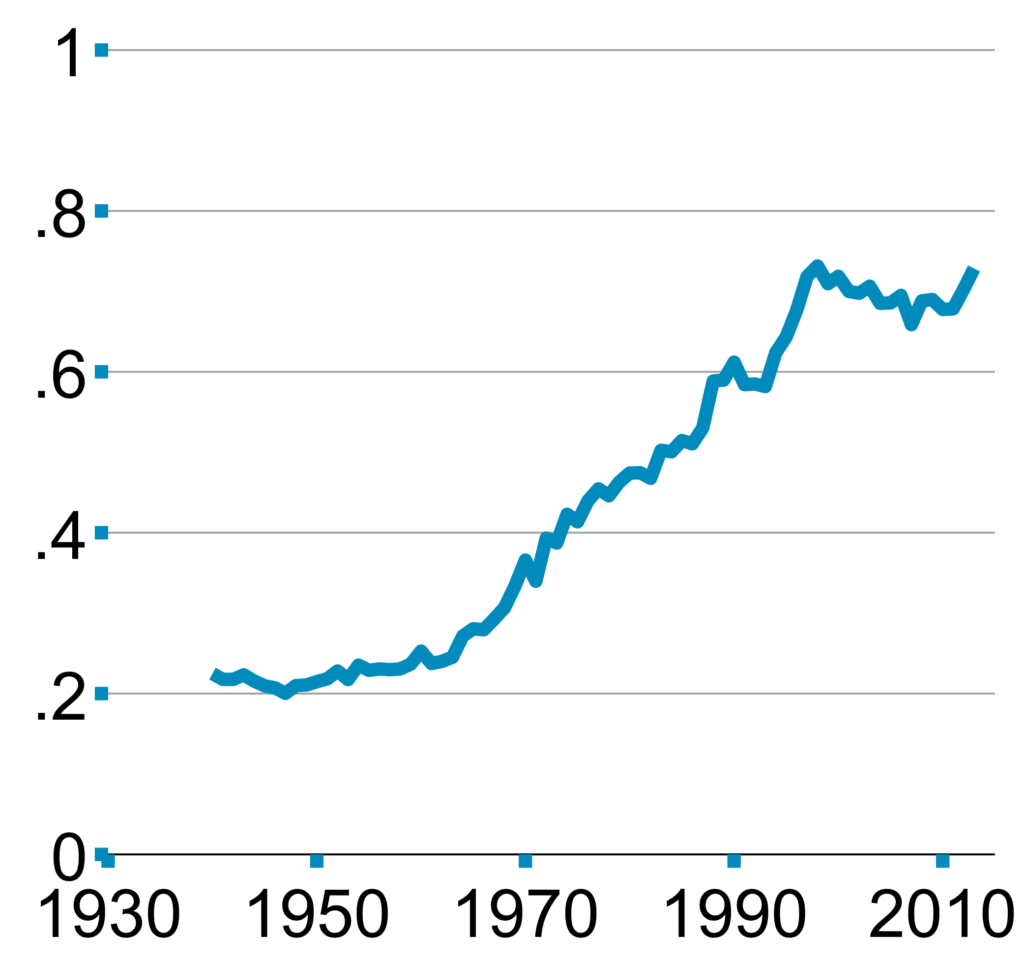
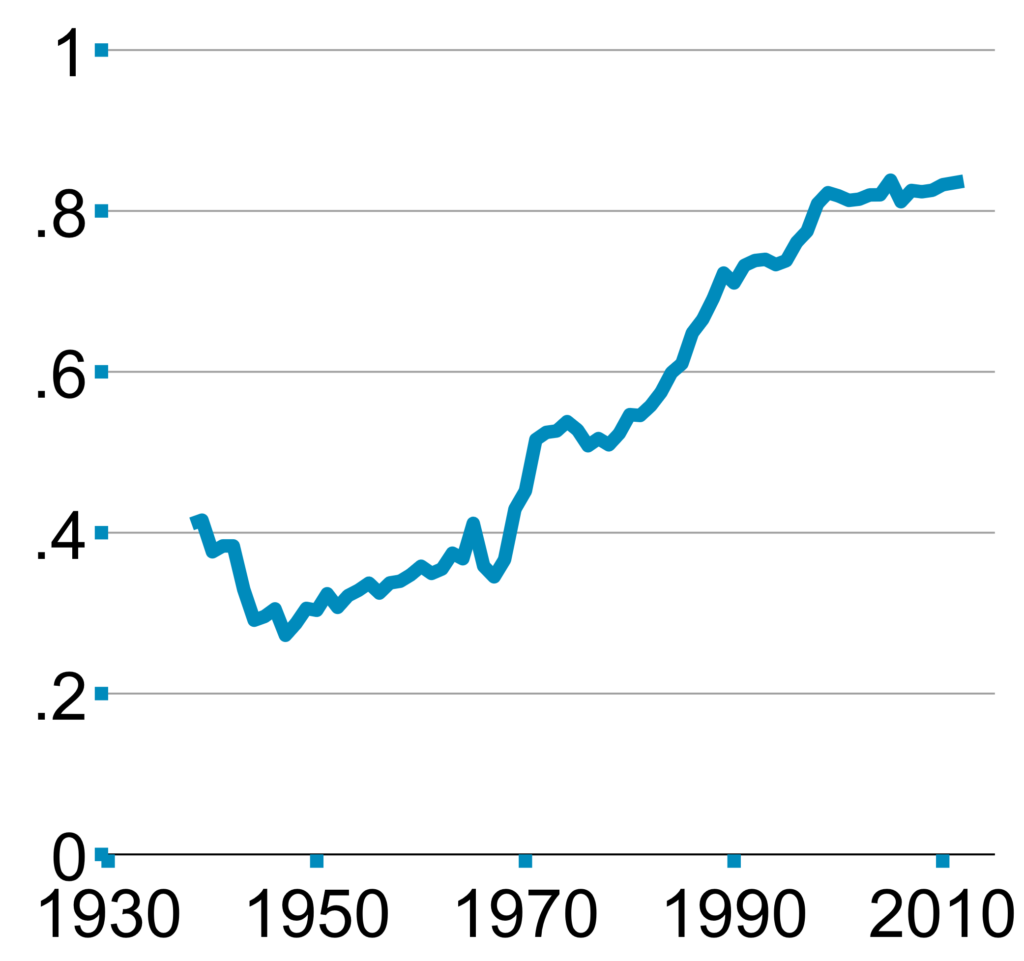
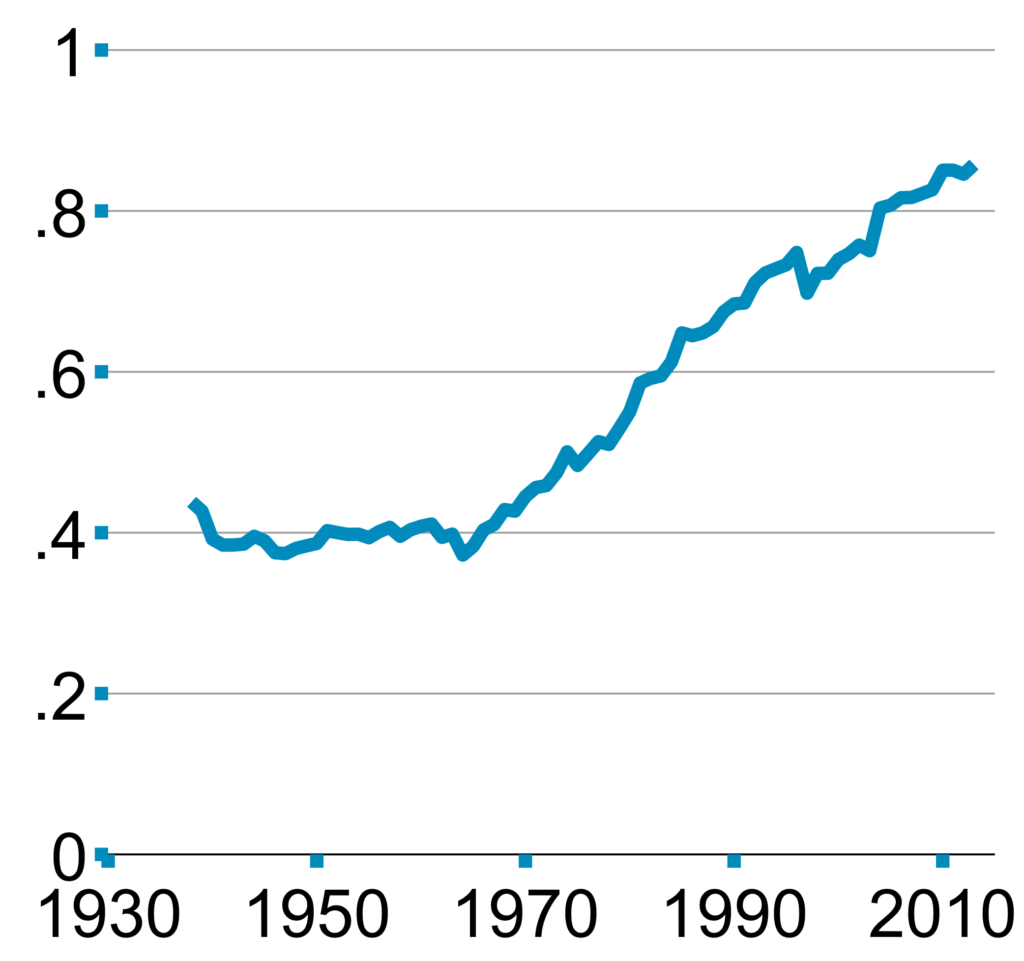
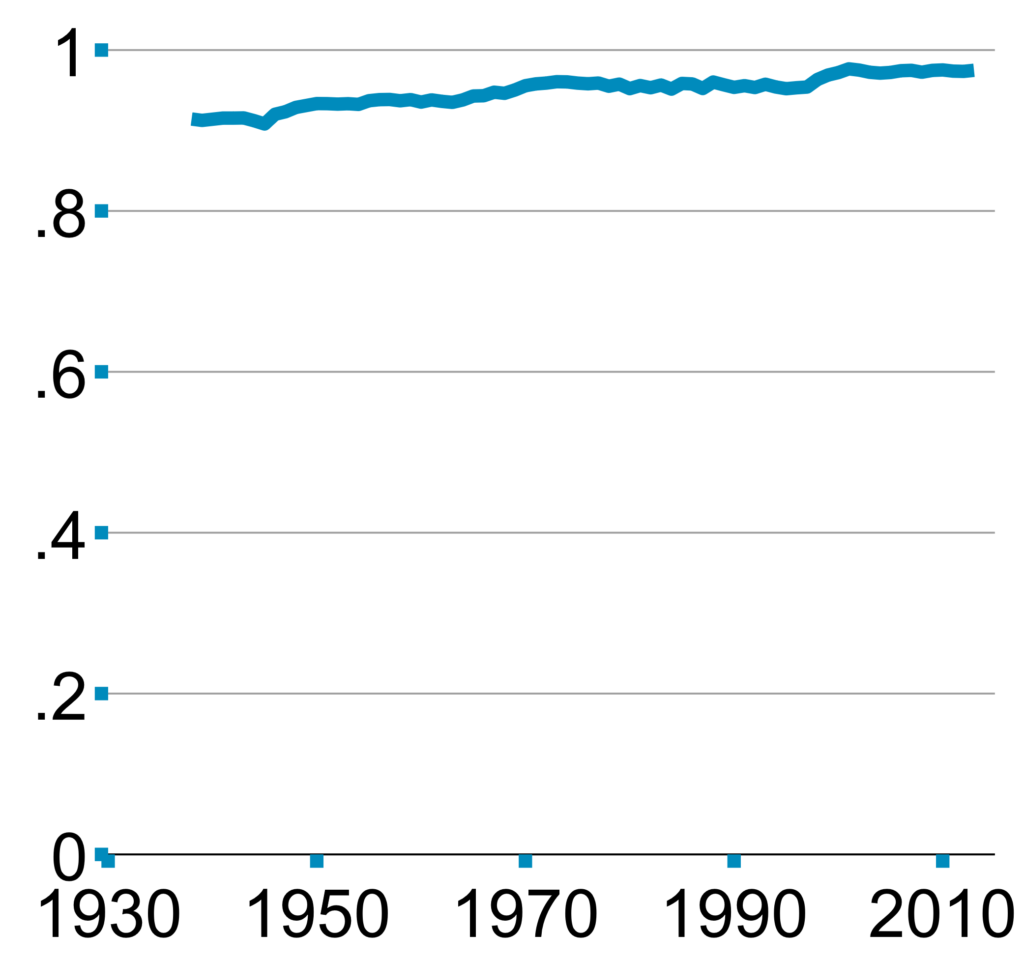
Rising concentration occurred in most industries, but with different timing.
The phenomenon was stronger in manufacturing in earlier decades, and stronger in services and trade (retail and wholesale) in later decades.
Main Sectors
Assets
Net Income
Business Receipts
Hover to see more information
Agriculture

Construction
Finance
Manufacturing
Mining
Services
Trade
Utilities
Subsectors

Asset share of top 1%
Finance
Banking
Finance
Insurance
Finance
Real Estate
Manufacturing
Apparel and Leather

Manufacturing
Chemicals
Manufacturing
Electrical
Manufacturing
Food
Manufacturing
Machinery
Manufacturing
Metals
Manufacturing
Paper
Manufacturing
Plastics
Manufacturing
Printing
Manufacturing
Stone
Manufacturing
Transportation
Manufacturing
Wood
Manufacturing
Other
Mining
Oil and Gas
Mining
Other
Services
Business
Services
Entertainment
Services
Hotels
Services
Personal
Services
Other
Trade
Retail
Trade
Restaurants
Trade
Wholesale
Utilities
Communications
Utilities
Electricity and Gas