Business Concentration

Documentation

Overview

We digitize  data from historical publications of the Internal Revenue Service (IRS). The IRS has a longstanding tradition of collecting detailed statistics for individuals and businesses going back to the Revenue Act of 1916, and the Statistics of Income (SOI) was first published in 1918 (with data for 1916).

Statistics of Income

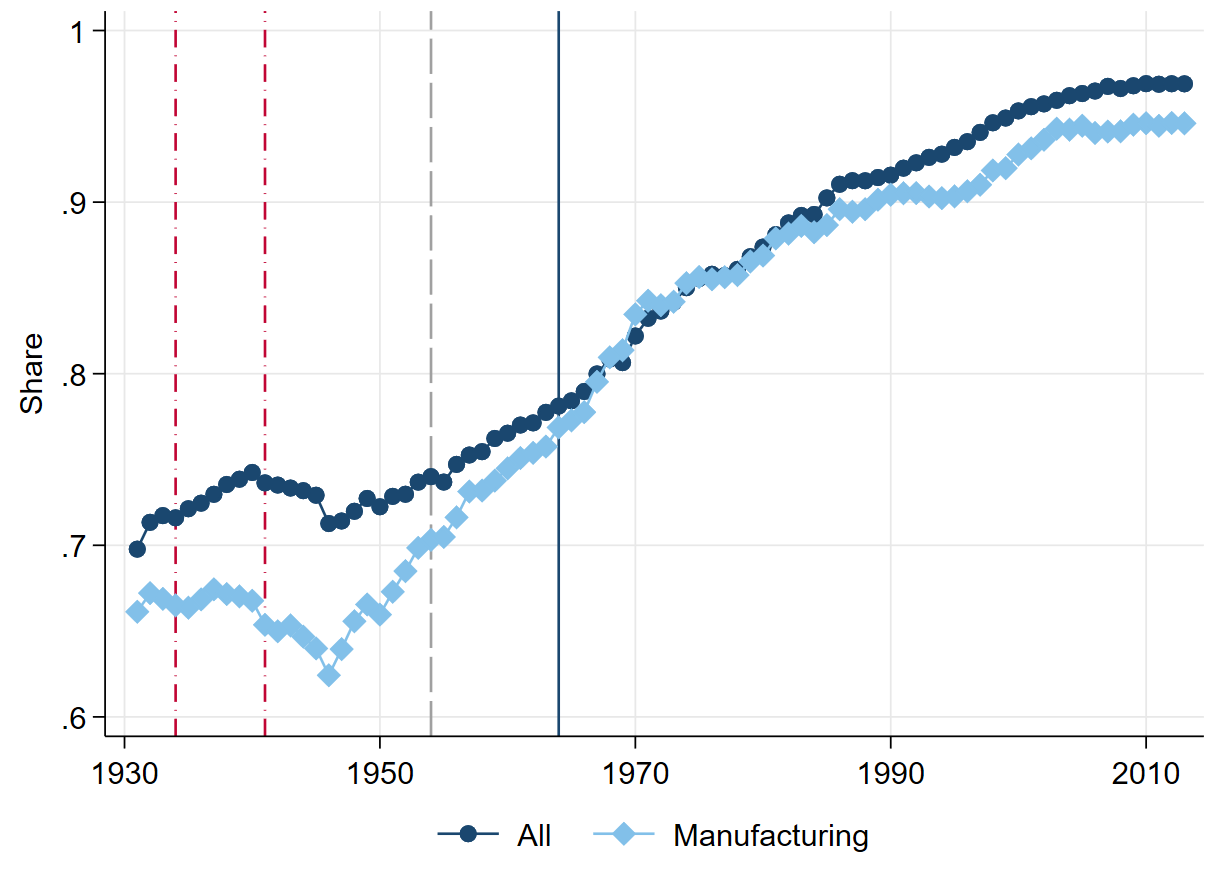
Initially the SOI included only basic statistics on corporations, but over the years the section on corporations has become increasingly detailed, with more cross-tabulations and variables. In addition to data on  receipts and net income, the SOI also contains data on balance sheets, which derives from (end-of-fiscal-year) balance sheets submitted by corporations with their tax returns. Using micro data from these submissions, the SOI provides tabulations of businesses by size of net income and sector since 1918 (which ended in the 1970s), by size of assets and sector since 1931, and by business receipts and sector since 1959. We use these size tabulations to study trends in corporate concentration over the long run. Corporate businesses in the tabulations by size include both C-corporations and S-corporations in the economy; the underlying data  come from corporate  tax returns (Form 1120 or 1120-S). For noncorporates (partnerships and nonfarm sole proprietorships), size bins are published in some years in separate SOI publications. We also transcribed these data whenever available.

The SOI publications are accompanied by the Corporation Source Book, which is a series of initially unpublished volumes containing tabulations with more detailed classifications compared to the published reports. The Corporation Source Book is digitally available through the IRS and the Electronic Records Division at the U.S. National Archives and Records Administration from 1964. The advantage of the Corporation Source Book data is that it includes more granular sector data and additional income and balance sheet items. We use the Corporation Source Book whenever available. The earliest SOI publications were based on the analysis of all submitted corporate tax returns. In later years, the SOI used estimates from sample data. Starting in 1951, the IRS began to use a stratified probability sample to provide estimates for the whole population. In these samples the IRS varied the sampling rate by size (measured using the size of total assets or the size of net income) to guarantee reliable totals. Accordingly, the sample usually included the universe of businesses in the top brackets. Therefore, the transition to sample data should not be accompanied by large effects on corporate concentration.

100 Years of Rising Corporate Concentration

Industry Classification

The SOI assigns a single industry code to each business based on the industry that represents the largest percentage of its total business receipts. For studies using long-run data by industry, a common task is to address changes to the industry classification systems over time. We harmonize the different industry classification systems to construct consistent industries. The SOI industry classification can be broadly separated into three periods. Between 1931 and 1937, the IRS followed its own industry classification. In 1938, the IRS adopted the newly created SIC industry classification system with a few small modifications and followed its various vintages until 1997. In 1998, the IRS began to use NAICS codes. Broad industrial groupings remained relatively stable within these three periods, which allows us to build consistent definitions for main sectors (roughly at the level of one-digit SIC codes) and subsectors (roughly at the level of two-digit SIC codes). 

Panel A presents how our main sectors correspond to Industrial Divisions in the SIC classification system and NAICS codes. Panel B shows the construction of the subsectors. These subsectors are also designed to maximize the comparability with industries in BEA data (including the BEA fixed asset tables and NIPA accounts), since our main analyses rely on BEA data to measure various outcomes. If we are not mapping into industries in BEA data, then we can further break down several subsectors. Among “Construction,” we can have “Construction: Buildings” (SIC 15, NAICS 236), “Construction: Heavy Construction” (SIC 16, NAICS 237), and “Construction: Special Trade” (SIC 17, NAICS 238). Among Mining, we can have “Mining: Metal” (SIC 10, NAICS 2122), “Mining: Coal” (SIC 12, NAICS 2121), and “Mining: Non Metallic” (SIC 14, NAICS 2123). Among “Manufacturing: Apparel,” we can have “Manufacturing: Apparel and Textiles” (SIC 22 and 23, NAICS 313, 314, and 315) and “Manufacturing: Leather” (SIC 31 and NAICS 316). Among “Trade: Retail,” we can have “Trade: Retail: Apparel” (SIC 56, NAICS 448), “Trade: Retail: Automotive” (SIC 55, NAICS 441 and 447), “Trade: Retail: Building Materials” (SIC 52, NIACS 444), “Trade: Retail: Food” (SIC 54, NAICS 445), “Trade: Retail: Furniture” (SIC 57, NAICS 442), “Trade: Retail: General Merchandise” (SIC 53, NAICS 452) and “Trade: Retail: Miscellaneous” (SIC 59, NAICS 446, 451, 453, and 454). Among “Services: Other,” we can have “Services: Repair” (SIC 75 and 76, NAICS 532 and 811) and “Services: Miscellaneous” (SIC 89, NAICS 561, 61, 62, and 813).

Bracket Deletion

For certain size bins at the industry level, financial data is suppressed to avoid disclosing information of individual businesses. This problem rarely arises in the main sector data, but becomes more common at the subsector or the minor industry level. For some of the early SOI issues, we can manually back out the missing values using adding up constraints from the hierarchical industry and bracket structure. In later years, additional precautions have been introduced by the IRS to preserve taxpayer confidentiality by deleting information from additional size and industry brackets whenever necessary. In these cases, we join the deleted brackets (and all brackets in between) into one large bracket, and back out the financial data using the difference of the total and all other brackets. While this approach generally works very well and does not create problems for the calculation of concentration indices, in a handful of cases the number of size brackets is reduced too much to calculate consistent and robust top shares. We linearly interpolate data for these years.

Accounting

For the reporting of financial information, firms provide their balance sheets (assets and liabilities)
in Section L of Form 1120 and are instructed to use “the accounting method regularly used in keeping
the corporation’s books and records” (see Form 1120 instructions). In other words, balance sheet
items in Form 1120 (and correspondingly the SOI) largely follow what companies do for financial
statements (with some possible differences such as the treatment of foreign affiliates and special purpose vehicles). Mills, Newberry, and Trautman (2002) provide detailed discussions about the relationship between financial information in SOI data and in firms’ annual reports. For assets and sales, we show in Section 3.2 that the size of top 500 firms estimated from our SOI data is similar to that calculated using Compustat data, so SOI data are in line with financial statement data. For net income, the SOI uses tax depreciation but the concentration series by net income is not our primary focus. Section 3.3 compares net income in SOI and NIPA (where the BEA makes adjustments to use economic depreciation instead), and we find the results are similar in the aggregate. Overall, reporting differences are unlikely to drive the main time trends we observe (given the high consistency among concentration trends by assets, receipts, and net income).


A small fraction of companies do not submit information about their balance sheets together with their tax returns. Reports without balance sheets are usually from corporations without assets (liquidations, dissolutions, acquisitions), foreign corporations doing business in the United States, and a small number of corporations that fail to supply balance sheet information. Until the SOI of 1958-59, these filings are included in all tabulations “by net income,” but excluded from tables pertaining to balance sheet information. Starting in 1959-60, the IRS included businesses with zero assets in the balance sheet tabulations and imputed data for businesses with missing balance sheets using information from the returns of businesses with both income statements and balance sheets in the same industry. Taken together, before 1959, the omission of businesses with missing balance sheet information in the SOI asset bin tabulations could affect the number of businesses in our calculations (for the asset share of top businesses). The left panel of the figure shows the share of returns in each year with balance sheet information and the receipt share accounted for by these returns. For example, in 1950 about 10 percent of tax returns representing 1.2 percent of total receipts did not include a balance sheet. The figure also shows that both the share of returns without balance sheet information and their receipt share  declined over time. We can provide robustness checks by either assuming that the businesses with missing balance sheet information fall in the smallest asset size bin, or using information on their receipts to impute which asset size bins they belong to (assuming they have the same assets-to-receipts ratios as the industry as a whole). The right panel compares our baseline concentration estimate to a concentration estimate with imputed assets for returns without balance sheets. Both series follow each other closely. We find the same level of consistency also at the sectoral level (results not shown).

Consolidation

For businesses with subsidiary affiliates, the SOI reports consolidated affiliates as one entity. For instance, the SOI in 2013 (as well as in other years) writes: “A consolidated return filed by the common parent company was treated as a unit and each statistical classification was determined on the basis of the combined data of the affiliated group.” We follow IRS publications to refer to an entity in the SOI tabulations as a “business.” The IRS allows corporations to file consolidated returns if at least 80 percent of the equity of each affiliate is owned within the group. Corporations that chose to file consolidated returns in one year are generally also required to file consolidated returns in the subsequent years. The consolidation privilege is granted to all affiliated domestic corporations except regulated investment companies (RICs), real estate investment trusts (REITs), tax-exempt corpo-rations, Interest Charge Domestic International Sales Corporations (IC-DISCs), and S-corporations. Life insurance companies can file consolidated returns with other life insurance companies without restrictions. In recent years at least, eligible firms generally elect to consolidate, given more favorable treatments when consolidated (e.g., when consolidated the sales among affiliates do not generate taxes, and gains and losses across affiliates can be netted). 

Rules on consolidation for tax purposes have had several changes over time. First, the 80% ownership requirement applicable today dates back to 1954. Prior to 1954, the ownership threshold was 95%. Second, consolidated returns were often taxed at higher rates before the 1960s. In 1932 and 1933, consolidated returns were subject to an additional tax of 0.75 percent. In 1934 and 1935, the additional tax increased to 1 percent. No additional tax was imposed between 1936 and 1941, but the consolidation privilege was significantly limited (see below). Between 1942 and 1963, corporations filing consolidated returns were subject to a surtax on the group of two percentage points. The Revenue Act of 1964 eventually repealed the two percent surtax for consolidated returns, so surtaxes no longer applied since 1964. Finally, consolidation was mandatory between 1918 and 1921 and voluntary after 1922. Then between 1934 and 1941, there was a change in procedure whereby all corporations (except for railway companies that were affiliated with each other) were not allowed to file consolidated returns. This change led to an upward shift in the number of returns and a downward shift in concentration. While this policy change only induced a relatively modest decline in the top 1% asset share for the whole economy, its effects in sectors with many consolidated returns (particularly Utilities and Manufacturing: Chemicals) were more sizeable. 

We adjust the 1934 to1941 concentration estimates for all sectors using two approaches. First, if we have data before 1934 and after 1942, then we scale the 1934 to 1941 data to the 1933 and 1942 benchmarks and divide the remaining level difference equally over the 1934 to 1941 period. This allows us to rescale the data to the correct level, while preserving the time trends of the 1934 to 1941 period. Second, for some subsectors, our concentration estimates only begin in 1938 (with the introduction of SIC industry codes). For these sectors, we assume that concentration did not change between 1941 and 1942 and rescale earlier years accordingly. The dashed line with circles shows 1% asset shares without adjustment and the dashed line with triangles shows the adjusted series.

One possible concern is that changes in the prevalence of consolidation may affect the concentration trends we observe. We make three observations. First, we digitize data on the share of consolidated returns in total returns using information about consolidated returns in the SOI. This figure shows the share of consolidated returns in the total number of returns (circles), and the share of assets from consolidated returns in total assets (diamonds). We observe a decrease in the prevalence of consolidated returns between early 1930s and 1940s. Then the prevalence of consolidated returns increased from mid-1960s to 1980s, roughly returning to the prevalence of consolidated returns in early 1930s. Meanwhile, top 1% asset shares were much higher in 1980s relative to 1930s. After 1980s, the prevalence of consolidated returns decreased in number (though not much in their shares of total assets), while top 1% shares continued to rise. 

Second, within each subperiod of consolidation rules (1934 to 1941, 1942 to 1954, 1954 to 1964, and after 1964), we generally observe rising top 1% asset shares. Here we present the final top 1% asset shares in our data, using manufacturing and aggregate series as examples. The only modification to the raw results from the SOI is the adjustment for the 1934 to 1941 period as explained above. 

Finally, the consolidation rules apply to all sectors and the consolidation trends are largely similar across sectors, but the concentration trends display differences in the timing of rising concentration. In the analyses of the mechanisms behind rising concentration, we use time fixed effects to isolate the timing differences in rising concentration across industries; these time fixed effects should absorb the impact of changes in consolidation rules which apply to all industries.

Investment composition from BEA fixed asset tables​

The BEA fixed asset tables report the investment composition by industry on an annual basis since 1901. There are 39 types of equipment, 31 types of structures, and 25 types of intellectual property. We include asset codes starting with “EP1″ (computing equipment), “ENS” (software), and “RD” (R&D) in the numerator, and investment in all categories in the denominator. We match BEA sectors to our main sectors and subsectors, following the Table bellow (Industry Mapping with BEA Fixed Asset Tables). We drop 5210 Federal Reserve Banks in BEA fixed asset tables.

Industry output from national accounts​

We also use industry value added and gross output from the BEA. The Tables bellow (Industry Mapping with NIPA: Pre-1997 and Industry Mapping with NIPA: Post-1997) show the mapping between industries in NIPA and our main sectors and subsectors. We do not reassign different components of “Information” and we do not reassign “Waste management and remediation services” to “Utilities: Electric, Gas and Sanitary Services” because detailed breakdown for these industries was not available from 1947 to 1962.